Financial models can look intimidating at first. Open a large spreadsheet packed with formulas, figures, tabs, and forecasts, and it may feel like you need a finance degree just to find the starting point.
The good news is that most models have a clear purpose. Some help you understand how a company makes money. Others estimate what a business may be worth. Or, they test what could happen under different conditions. Yes, creating an effective model can be a challenge. However, you have to start with the basics.
Without further ado, let me break down the different types of financial models, including the most popular: 3-Statement, DCF, LBO, M&A, and more.
Key Takeaways
- Different models serve different goals: Some models forecast results, while others focus on valuation, deals, investment returns, or something else.
- Three statements often work together: Income statements, balance sheets, and cash flow statements form a 3-statement model, which is the base of many financial models.
- There are many types of financial models: These include DCF, LBO, M&A, IPO, and more.
- Assumptions Matter: A model’s output depends heavily on the numbers, formulas, and expectations you enter.
What Are the Different Types of Financial Models?
Businesses and investors can use financial models for budgeting, forecasting, valuation, investment analysis, planning, and more. However, there are many different types of financial models.
Learning the different types of financial models can help you understand which one makes sense to use. Think of each model as a different tool in a toolbox. You wouldn’t use a hammer to tighten a screw. Similarly, you wouldn’t use every financial model for the same job.
Here are some of the most common types of financial models.
3-Statement Financial Model
A 3-statement model connects a company’s three main financial statements:
- Income statement: Shows a company’s revenue, expenses, and resulting profit or loss over a set period.
- Balance sheet: What the company owns (assets), what it owes (liabilities), and the value left for shareholders (equity) at a specific point in time.
- Cash flow statement: Tracks how cash moves into and out of the business.
A 3-statement model links these three reports together to project future financial performance. Therefore, this model is often a useful starting point, and many other financial models build on it. These include discounted cash flow (DCF), mergers & acquisitions (M&A), leveraged buyout (LBO), corporate budget and consolidation, and initial public offering (IPO) financial models.
Discounted Cash Flow (DCF) Financial Model
A discounted cash flow, or DCF, model is commonly used to estimate what a business or investment may be worth. It is a key financial model used by investment bankers, private equity, “buy side” investors, and equity research.
It comprises:
- Cash flow forecast: A DCF model usually begins by forecasting future cash flows.
- Discount rate: The appropriate discount rate depends on the cash flow being valued. Free cash flow to the firm (FCFF) is generally discounted using the weighted average cost of capital (WACC). In contrast, free cash flow to equity (FCFE) is discounted using the required return on equity.
- Terminal value: This value represents the estimated value of the business beyond the main forecast period. It’s commonly estimated using either a perpetual-growth approach or an exit-multiple approach.
- Present value (PV) calculation: What future money is worth right now. Because of the time value of money and investment risk, a dollar received in the future is generally worth less than a dollar received today. To get the PV, you divide future cash flow by one plus the discount rate, raised to the power of the year number.
DCF models can be useful, but they depend heavily on assumptions. Small changes in growth forecasts or the discount rate can lead to very different valuations. That’s why I wouldn’t treat a DCF result like a magic answer. Instead, it’s better viewed as an estimate based on a specific set of assumptions. One that can help you gauge how much a potential investment is worth.
Leveraged Buyout (LBO) Financial Model
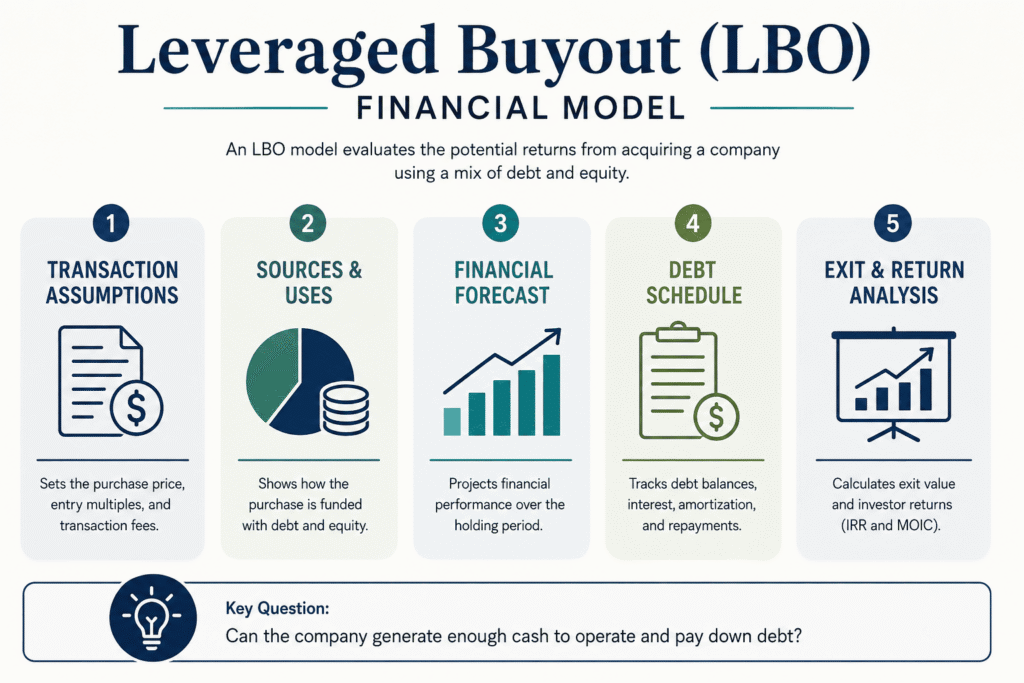
A leveraged buyout, or LBO, model looks at the potential returns from buying a company using a mix of investor money and debt. Hence the term “leveraged.” The word “leveraged” refers to using borrowed money. LBO’s are one of the more complex financial models.
In a typical LBO analysis, the model covers factors such as:
- Transaction assumptions: Sets the purchase price, entry multiples, and transaction fees.
- Sources and uses table: Details how the purchase is funded using debt and sponsor equity.
- Financial forecast: Financial performance over an assumed holding period, often several years; historically, around five years has been common, although actual private-equity holding periods have recently lengthened.
- Debt schedule: Tracks debt balances, interest expense, required amortization, and any optional repayments or cash sweeps based on available cash flow and the terms of each debt tranche.
- Exit and return analysis: Calculates the final sale value and investor return metrics like Internal Rate of Return (IRR) and Multiple on Invested Capital (MOIC).
One major question an LBO model answers is whether the company can generate enough cash to operate while also paying down debt. Private equity firms often use LBO models to assess how a potential acquisition could perform under different financing structures.
Merger & Acquisitions (M&A) Financial Model
A merger and acquisitions model looks at what could happen financially when one company buys or combines with another. The model may examine how the transaction could affect the buyer’s earnings and financial statements.
It can also include assumptions about financing, purchase price, new shares, debt, and potential cost savings. A common goal is to determine whether the transaction could increase or decrease the buyer’s earnings per share after the deal.
Key components of an M&A financial model are:
- Purchase price: The total cost to buy the target company.
- Funding mix: How the buyer pays for the deal using cash, debt, or new stock.
- Synergies: Expected money saved or extra revenue made after the companies join.
- Pro forma statements: The combined financial position and results as if the transaction had occurred, incorporating relevant transaction adjustments.
Because mergers can involve many moving parts, these models can become more detailed than basic forecasting models.
Initial Public Offering (IPO) Models
An initial public offering, or IPO, model helps estimate what a company may be worth when it starts selling shares to the public. The model can look at the company’s financial results, expected growth, share count, and possible IPO price range. It may also compare the business with similar public companies to see how the market values them.
An IPO model can help answer questions such as:
- What could the company be worth?
- What might each share be priced at?
- How much money could the company raise?
- How could the IPO affect existing shareholders?
- How does the proposed valuation compare with similar companies?
It usually comprises:
- Three-statement forecast: Projects the income statement, balance sheet, and cash flow statement into the future.
- Offering assumptions: Details the number of new shares issued, expected share price, and gross proceeds.
- Use of proceeds: Tracks how proceeds from newly issued company shares may fund growth, repay debt, or cover transaction costs. Proceeds from shares sold by existing shareholders go to those shareholders rather than the company.
- Valuation section: Uses methods such as DCF and comparable-company analysis to estimate a valuation range and help inform the proposed IPO price.
The IPO model may also show different scenarios based on changes in the share price or shares sold. I like to think of an IPO model as a bridge between a private company’s financial history and its possible value in the public market. It doesn’t predict exactly what investors will pay, but it can help companies and advisers understand a reasonable range.
Sum-Of-The-Parts (SOTP) Financial Model
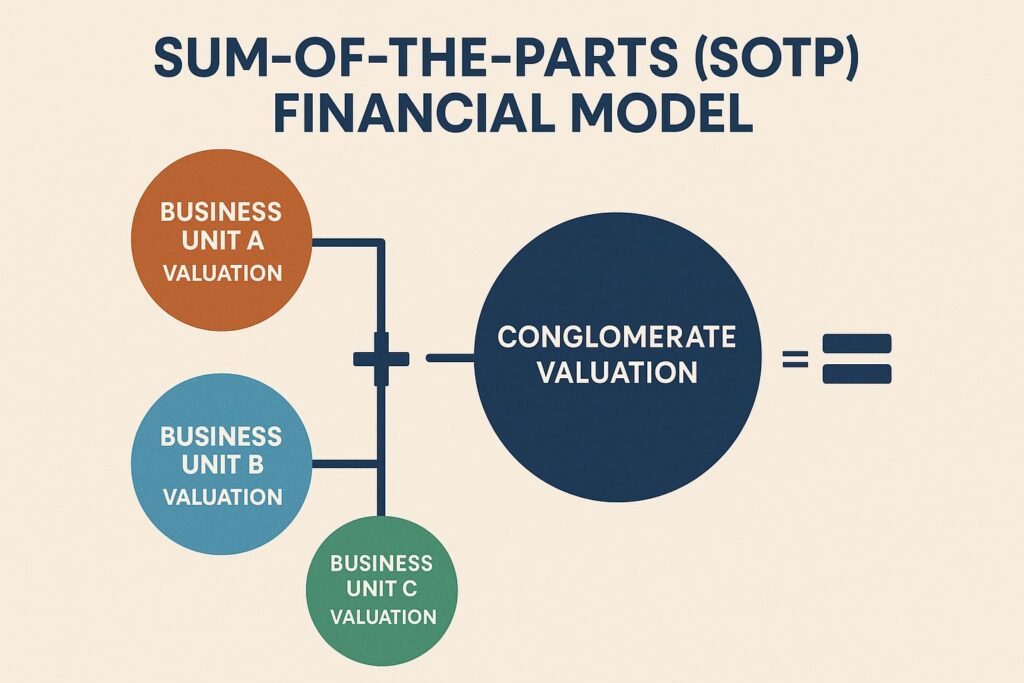
A sum-of-the-parts (SOTP) model values different business units separately and then combines those values to get a total value. This approach may be useful when an umbrella or parent company operates several businesses that are very different from one another.
Imagine a company that owns a software business, a retail chain, and a financial services division. Using one valuation method for the whole company does not tell the full story. Instead, each business unit is valued separately. If the segment valuations represent enterprise value, those values are added together, then adjusted for items such as net debt, non-operating assets, and other corporate-level assets or liabilities to arrive at implied equity value.
A SOTP model is usually achieved by:
- Isolating segments: Separating the business into distinct operating units (e.g., software, retail, financial services).
- Applying specific methods: Valuing each unit using the metric that fits its specific industry best, such as a Discounted Cash Flow (DCF) or peer trading multiples like Price-to-Earnings ratio (P/E) or Enterprise Value to Earnings Before Interest, Taxes, Depreciation, and Amortization (EV/EBITDA).
- Combining and adjusting: Valuing each segment using an appropriate method and ensuring the resulting segment values are expressed on a consistent enterprise-value or equity-value basis before combining them.
Consolidation Models
A consolidation model combines the financial results of several business units, subsidiaries, or companies into one overall view. Similar to SOTP models, consolidation models are useful when a parent controls one or more subsidiaries or other entities and needs to present their financial results as a single economic group. Instead of looking at each one separately, the model brings their finances together.
A consolidation model may help track:
- Total company revenue
- Combined expenses and profits
- Cash across different business units
- Assets and liabilities
- Transactions between related companies
One important step is removing, or eliminating, transactions that happen between companies in the same group. For example, if one subsidiary sells a service to another, the seller records revenue even though it earned no revenue from outside the corporate group. Consolidation eliminates intragroup balances and transactions, including corresponding intragroup income and expenses, so they are not double-counted in group financial statements.
I like to think of a consolidation model as adding up several household budgets to see the finances of the whole family. Each part still matters, but the model gives you one clear picture of the entire organization.
Budget Financial Model
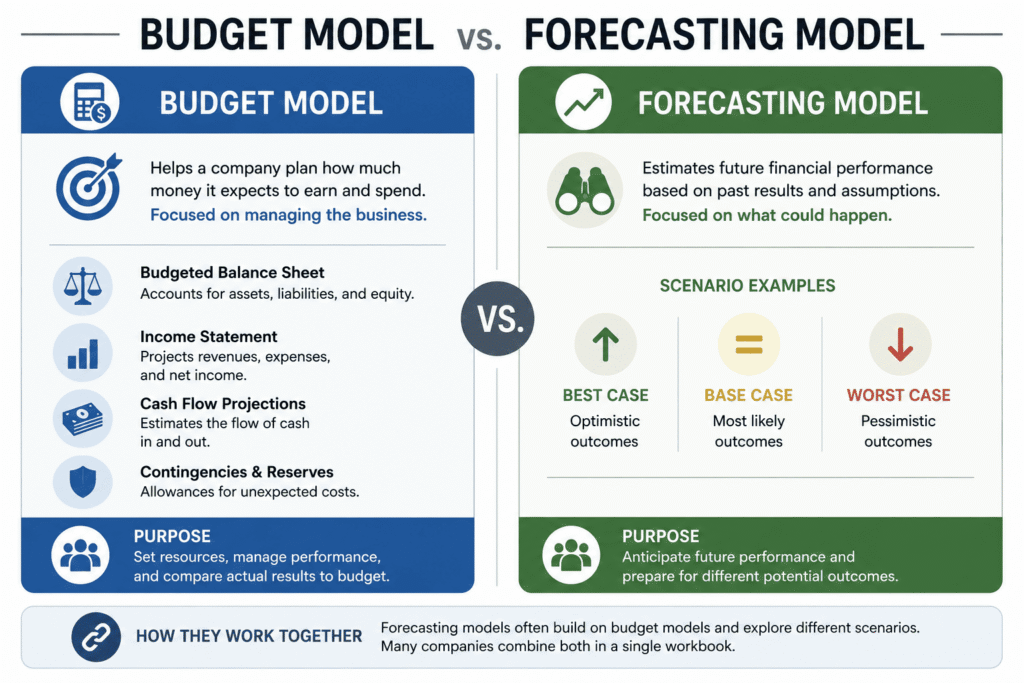
A budget model helps a company plan how much money it expects to earn and spend. Professionals in financial planning & analysis (FP&A) typically use this type of financial modeling.
It may include forecasts for:
- Sales
- Payroll
- Marketing
- Operating expenses
- Capital spending
- Cash flow
Unlike valuation models, a budget model is usually focused on managing the business rather than estimating what the company is worth. Companies can compare actual results with their budget to see where performance differs from expectations. If spending comes in higher than planned, for example, management can investigate the cause and decide on or make changes.
A budget model typically comprises:
- Budgeted balance sheet: It accounts for assets, liabilities, and equity.
- Income statement: It covers projected revenues, expenses, and net income.
- Cash flow projections: The estimated flow of cash in and out of the organization.
- Contingencies and reserves: Allowances that may be set aside for unexpected costs.
Forecasting Financial Model
A forecasting model is used in financial planning and analysis (FP&A) to estimate future financial performance based on past results and business assumptions. Similar to budget models, forecasts may cover revenue, expenses, profits, cash flow, and other finances. Businesses often create multiple forecasting scenarios instead of relying on one prediction.
For example, a model might include:
- Base case
- Best case
- Worst case
Scenario planning can help decision-makers understand a range of possible outcomes. After all, forecasts aren’t crystal balls. They’re structured estimates based on information available at the time. Sometimes they are combined with budget financial models to create one workbook.
Comparable Company Analysis
Also known as “comps,” comparable company analysis looks at how similar public companies are valued. Instead of forecasting a company’s cash flows far into the future, this approach compares financial measures across similar businesses. For example, an analyst may compare company values with measures such as revenue or earnings.
The tricky part is finding truly comparable companies. Two businesses may operate in the same industry but have very different growth rates, profit margins, and risk levels. It’s a bit like comparing two houses on the same street. They may look similar from the sidewalk, but one could have a new kitchen while the other hasn’t been updated since flip phones were cool.
A comparable company analysis is created by:
- Selecting a peer group: Identifying a sufficiently representative group of publicly traded companies with similar businesses and relevant characteristics such as industry, growth, profitability, risk, and size.
- Gathering financial data: Collecting key figures like revenue, earnings, and Earnings Before Interest, Taxes, Depreciation, and Amortization (EBITDA).
- Calculating valuation multiples: Computing standard ratios such as Enterprise Value-to-EBITDA (EV/EBITDA), Price-to-Earnings (P/E), or Price-to-Sales (P/S).
- Applying the multiples: Applying an appropriate peer multiple to the corresponding target-company metric to derive an implied enterprise value or equity value, depending on the multiple used.
Precedent Transaction Analysis
Precedent transaction analysis examines prices paid in past mergers and acquisitions involving similar companies. The goal is to see what buyers have previously been willing to pay for businesses with similar characteristics.
This method can provide useful context during acquisition or valuation work. However, past deals may have happened under very different market conditions. A buyer may also have paid a premium for strategic reasons that don’t apply to another company.
For that reason, precedent transactions are generally more useful as one part of a broader valuation process than as a stand-alone answer.
A precedent transaction analysis is created by:
- Extracting key financial metrics and transaction values from public filings or deal announcements.
- Calculating valuation multiples like Enterprise Value-to-Revenue (EV/Revenue) or Enterprise Value-to-EBITDA (EV/EBITDA).
- Applying the median or mean multiple of those past deals to the target company’s metrics to estimate its implied value.
Option Pricing Financial Model
An option pricing model helps estimate the value of an option. An option is a contract giving its holder the right, but not the obligation, to buy or sell an underlying asset at a specified price, subject to the contract’s expiration date and exercise terms.
These models look at several factors that can affect an option’s value, such as:
- The current price of the asset
- The option’s strike price
- Expected dividends or dividend yield
- Time left until expiration
- Expected magnitude of price movements, or volatility
- Interest rates
One well-known example is the Black-Scholes model, which estimates the value of certain options based on a set of assumptions. Other models, such as binomial models, can show how an option’s value may change over several possible price movements.
I think of option pricing models as estimating the value of a reservation. The more useful that reservation may become before it expires, the more value it can have.
These models can help investors and finance teams compare options and study possible outcomes. However, their results still depend on the assumptions used, so the estimated price isn’t a guarantee of what an option will be worth in the market.
Which Financial Model Should You Use?
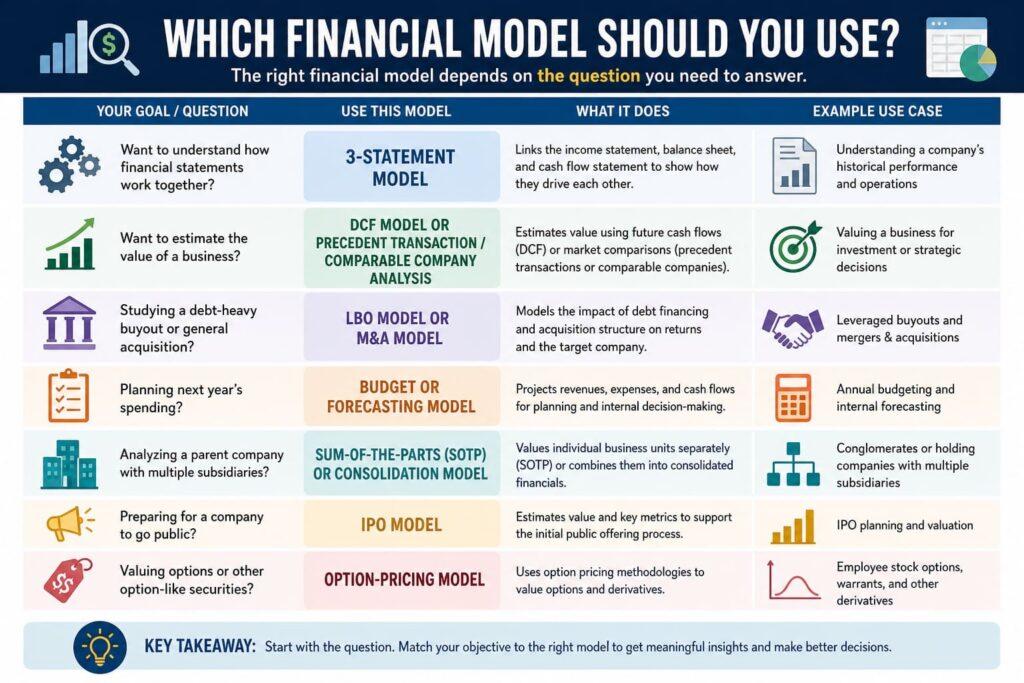
Choosing between the different types of financial models starts with the question you need to answer.
If you want to understand how financial statements work together, a 3-statement model can help.
If you’re estimating the value of a business, a DCF model or a precedent transaction or comparable company analysis may make more sense.
If you’re studying a debt-heavy or general acquisition, an LBO or M&A model is designed for that purpose.
If you’re planning next year’s spending, you probably don’t need a complicated acquisition model. A budget or forecasting model may do the job just fine.
If you’re analyzing a parent company with multiple subsidiaries, a sum-of-the-parts (SOTP) or consolidation model is where it’s at.
If you’re preparing for a company to go public, an IPO model may be appropriate.
And if you’re valuing options or other option-like securities, use an option-pricing model.
In practice, analysts and finance professionals often use more than one approach. Comparing results from multiple financial models can provide a broader view than relying on a single calculation.
Should I Study Financial Modeling?
Studying financial modeling can be worth it if you want to understand how businesses make financial decisions or if you’re interested in a career involving corporate finance, investing, valuation, analysis, or financial planning.
It’s especially useful for roles in investment banking, private equity, equity research, corporate finance, and financial planning & analysis (FP&A).
Depending on the job, you may need to:
- Build forecasts
- Value companies
- Analyze acquisitions
- Create budgets
- Test different financial scenarios
The models covered in this article, including 3-statement, DCF, LBO, M&A, budget, and forecasting models, are designed for many of these tasks. However, you don’t need to learn every type of financial model at once. A good starting point is a 3-statement model because it shows how the income statement, balance sheet, and cash flow statement work together.
From there, you can focus on the models most relevant to your goals. For example, someone interested in valuation may want to study DCF and comparable company analysis. In comparison, someone pursuing private equity may need to understand LBO models. If your focus is FP&A or corporate finance, then your focus will be budgeting and forecasting models.
Financial modeling is also a practical skill. Rather than only learning formulas or definitions, you’ll usually get the most value from actually building models, changing assumptions, and seeing how those changes affect the results.
Final Thoughts
Understanding the different types of financial models makes finance much easier to navigate. You don’t need to master every spreadsheet on day one, either. Start by understanding what question each model is built to answer.
A 3-statement model connects a company’s core financial reports. A DCF estimates value from future cash flow, while an LBO focuses on debt and investor returns. Other models can help with budgeting, forecasting, mergers, market comparisons, and more.
Once you understand the purpose behind each model, all those spreadsheet tabs start looking a little less scary.
If you want structured practice after you pick a model, start with our Corporate Finance Institute promo codes.
FAQs
What are the main types of financial models?
A 3-statement model is one of the most fundamental financial models and often serves as the foundation for more specialized analyses. Other common financial models include comparable company analysis, DCF, LBO, M&A, IPO, budget, consolidation, precedent transaction analysis, forecasting, option pricing, and SOTP models.
What is the most basic financial model to learn first?
A 3-statement model is a useful place to start because it shows how a business’s income statement, balance sheet, and cash flow statement connect. It’s also used as the basis for many other types of financial models. So, learning to build a 3-statement model is a great place to start financial modeling. You can also take a course to learn financial modeling.
What’s the difference between a DCF and an LBO model?
A Discounted Cash Flow (DCF) model estimates what a business or investment may be worth using expected future cash flows. In comparison, a Leveraged Buyout (LBO) model measures potential investor returns when buying a company using debt.
Are financial models always accurate?
No. Financial models rely on assumptions and forecasts. Their results can change when assumptions about growth, revenue, costs, interest rates, or other factors change. Analysts may also compare outputs from multiple models or valuation methods to get a broader perspective.
Do companies use more than one financial model?
Yes. Different models answer different questions, so analysts and businesses may use several methods when evaluating a company, investment, or financial plan. Comparing results from multiple financial models can provide a broader view than relying on a single calculation.

![ESG Institute Coupon [Verified Discounts]](https://www.miamiherald.com/careers-education/wp-content/uploads/sites/2/2026/09/esg-institute-discount-code-mh-1024x768.jpg)