How we reported and mapped South Florida’s (many) flood complaints

READ MORE
Floods of Trouble
A series exploring how real estate and climate change collide in South Florida.
Expand All
Flooding doesn’t stop at city limits. The data meant to track it often does.
That simple mismatch — between where water goes and how governments measure it — has long left South Florida with an incomplete picture.
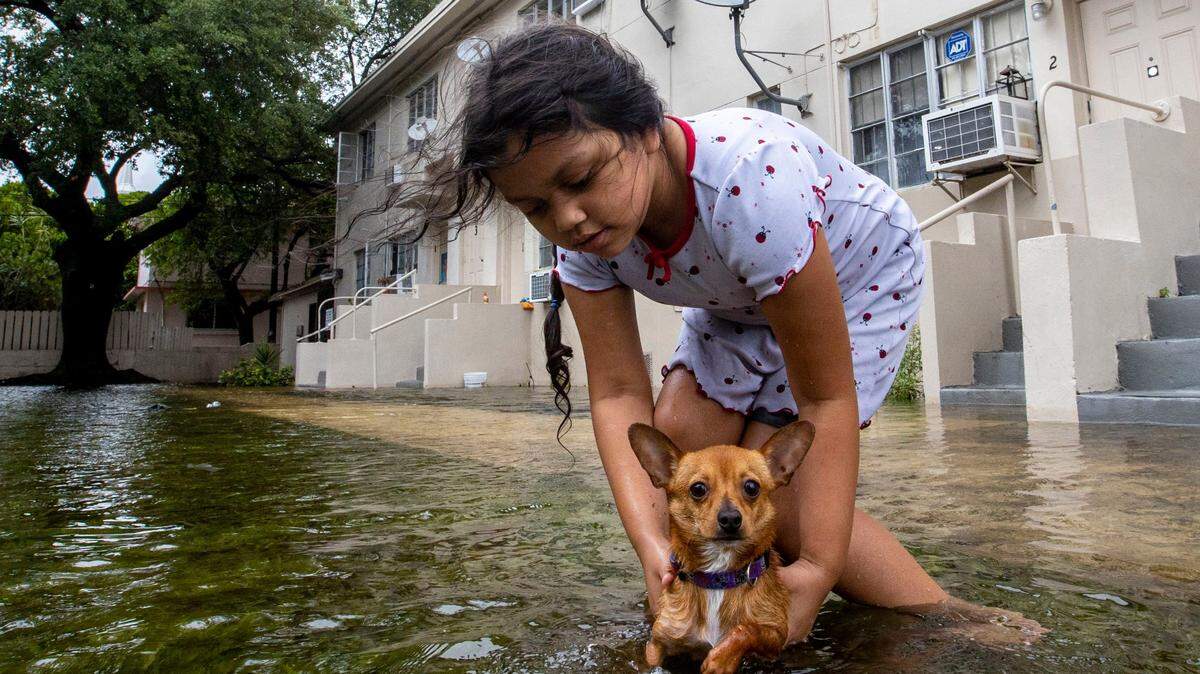
We’ve been documenting damage for years. We trudged through waist-high water when Edgewood was submerged in 2023, and again in Little Havana during the June 2024 floods; we stood there in rain boots, measuring sticks in hand for King Tides in Shorecrest and Hollywood. We sat through late-night city meetings on flood preparedness and stood alongside families at memorials for flood victims.
Time and again, it was clear that the realities facing these communities don’t match the residents’ expectations, FEMA’s maps nor optimistic real estate listings.
As a result, we turned to the complaints and requests of communities themselves to help identify gaps in understanding the extent of flooding in South Florida. We sought records from multiple municipalities in Miami-Dade, Broward and Monroe counties. The responses we received were just as varied as the governments and communities they serve. In the end, the data told us plenty — but also left many questions unanswered.
Some small municipalities, like El Portal and Miami Shores, don’t even track flood-related complaints or service requests. Yet, flooding is a major issue in those communities and has inspired multimillion dollar infrastructure projects to combat sea level rise and river flooding. Monroe County, one of the most flood-prone spots in the nation, does not explicitly track flood complaints.
In contrast, Miami-Dade County shared with us over 10,000 complaints collected by the City of Miami, requests relating to the nebulous categories of “storm flood/drainage” and “flooding/standing water - localized.” These catchall labels cover a wide range of issues; some reports could describe storm drain problems while others could document severe flooding of over 20 inches inside homes. Miami had more complaints than anyone else, probably because Miami tries very hard to collect the information. The City of Miami has a robust portal on its website, maintains a 311 Call Center and has contracted with ISeeChange to monitor residents’ submissions.
It appears to be far less straightforward for those residents living in unincorporated areas of Miami-Dade County, as the data we received from those communities was sparse, even in areas within FEMA’s highest flood risk zones where previous flooding has been noticed and photographed.
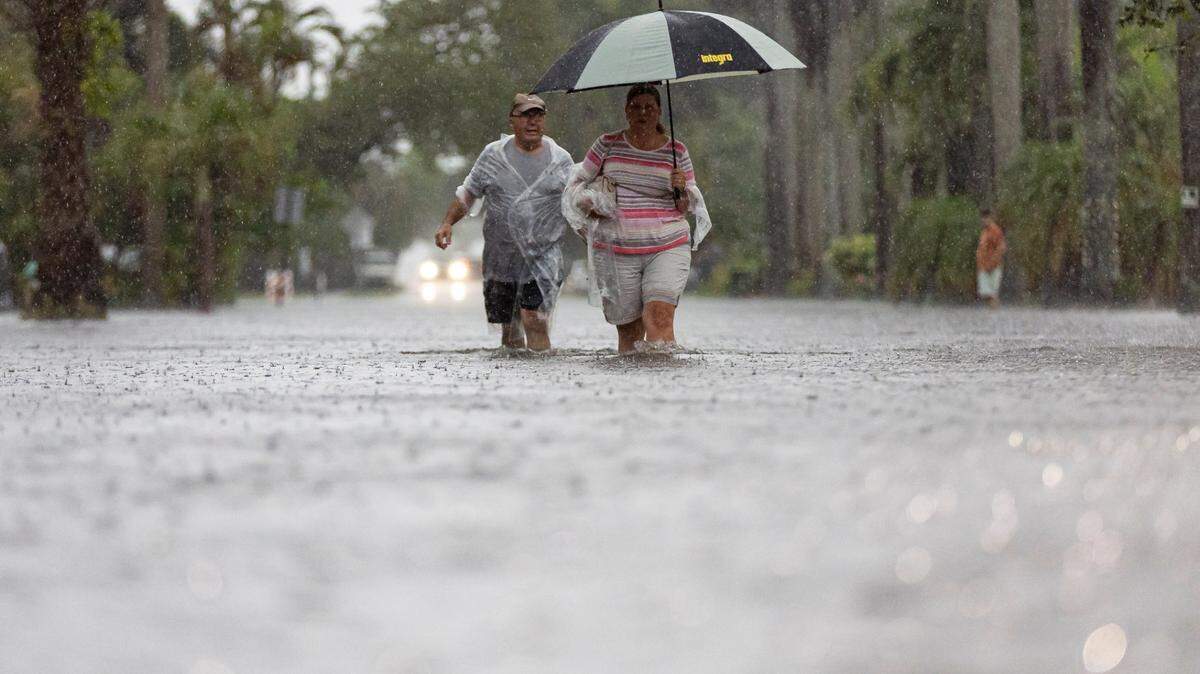
The City of Hollywood shared city complaints from mid-2021 to May 2024, covering ostensibly every kind of complaint from the police to noise to air conditioning to youth sports. We used natural language processing methods to filter these complaints to only relevant messages.
Residents are asked for measurements of water depth and whether the location has flooded before in Broward County’s Document the Floods dataset of more than 900 submissions across the county. Response after response checked off the box, “yes, it always floods here,” and measured depths in double-digit inches.
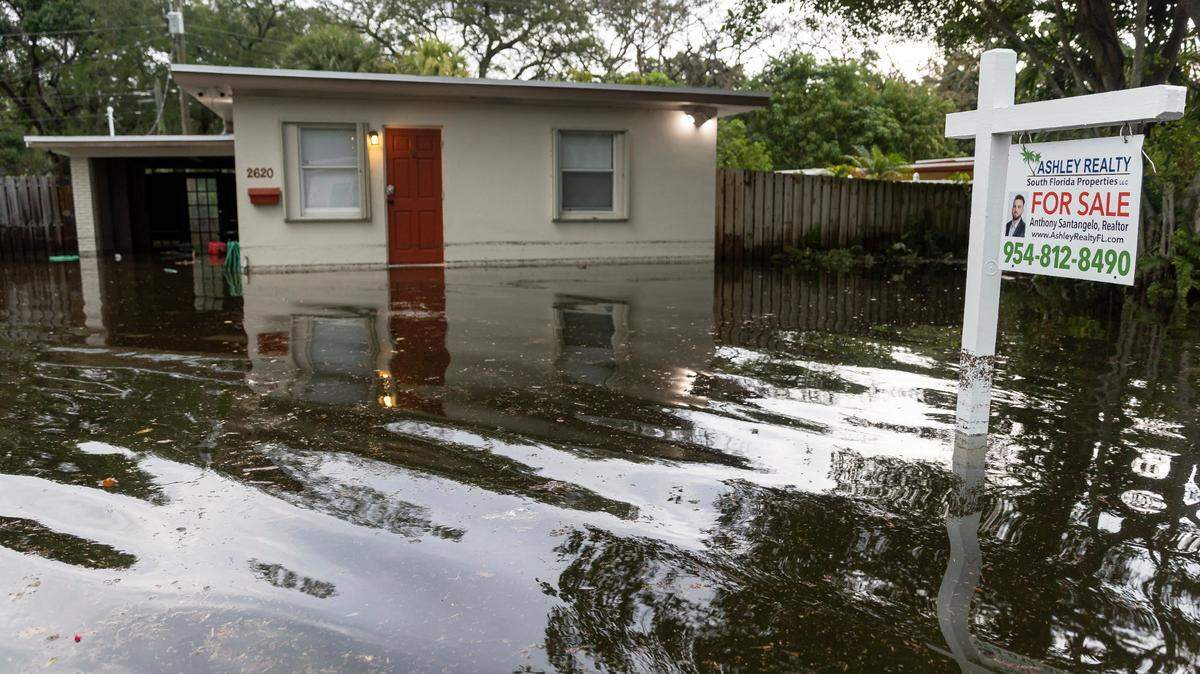
Our most thoroughly collected dataset came from Fort Lauderdale, which, in its pursuit of FEMA funding in the aftermath of the April 2023 ‘rainbomb’ went house to house inquiring about the effects of the latest major flood event. The product was a comprehensive dataset of over 1,000 locations of flooded buildings from a singular event within a matter of days.
Ultimately, our analysis is somewhat piecemeal, constrained by data that is divided along municipal boundaries and shaped by differing collection methods. The municipal lines in many ways act as invisible barriers in our understanding of the scope of the issue and likely as hurdles for communities’ responses, given that flooding doesn’t recognize political lines.
It also means these maps almost certainly reflect an underestimate of flooding across the region, perhaps a dramatic one.
The Miami Herald initially began this project looking at sea level rise and which communities would be “first to go” in South Florida. But after we commissioned a study from the University of Miami analyzing sea level rise flooding, we realized it was an incomplete picture. By the time the study was completed, the sea level rise projections it used were already outdated. It also became evident that South Florida’s unique conditions — such as its porous limestone and shallow water table — meant that even inland neighborhoods could face flooding risks as severe as those on the coast.
Flood complaints offered us the most current and most accurate available picture of present day and future flooding — even with all the caveats described above.
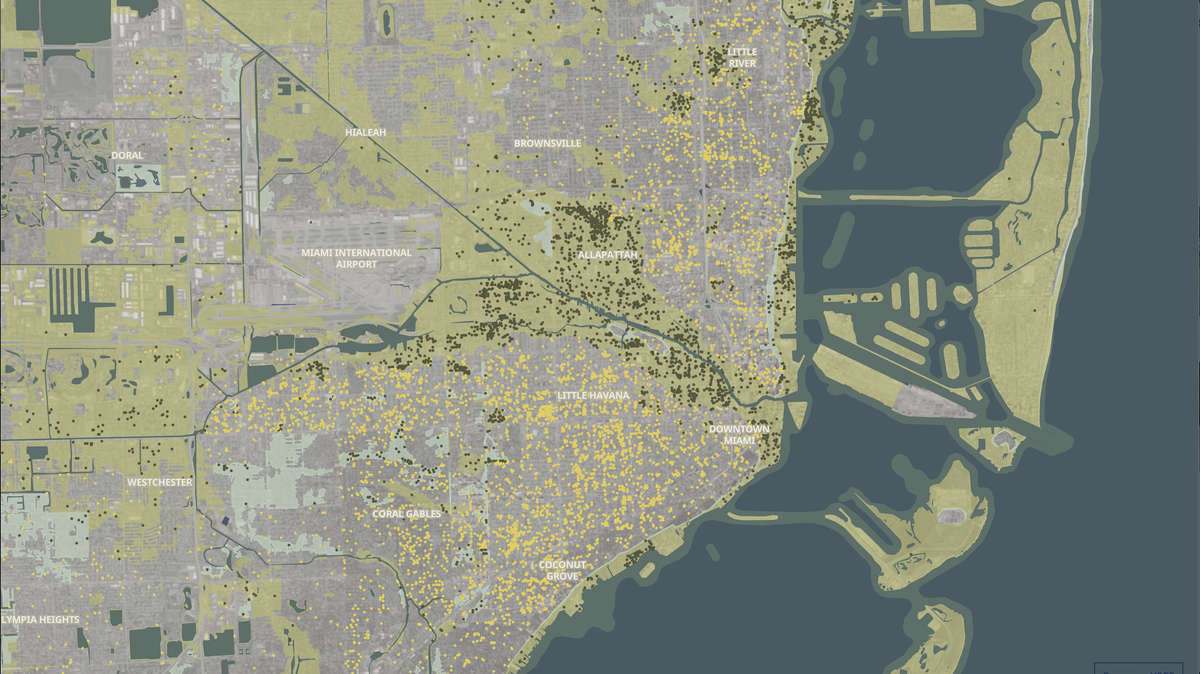
Complaints and Requests
Miami-Dade County / City of Miami
Miami-Dade County provided the Herald with a dataset of 13,296 service requests. 10,271 service requests were labeled as “Storm Flood/Drainage” within the City of Miami and 3,025 service requests were labeled as “Flooding/Standing Water - Localized” from the entirety of Miami-Dade county. The data provided was from January 2016 to February 2024.
While a vast majority of the requests included GPS coordinates, 27 records were manually geocoded using Google Maps based on the addresses provided in the data.
Some of the county-wide data is available to the public on the Miami-Dade County’s Open Data Hub.
The City of Miami communicated to the Herald that the flood-related service requests were submitted through various methods. Residents submitted requests to the 311 Call Center, Miami.gov and Miami-Dade County web pages, ISeeChange, made phone calls to City Department staff, Commissioner Offices staff, and Mayor Office staff.
City of Coral Gables
In response to the Herald’s public records request, the City of Coral Gables provided 877 reports related to flooding and drainage issues filed between February 2015 and December 2023. Residents submitted these reports through the city’s online portal or by phone, and the city shared the resulting records in multiple PDF files. Those files were processed using optical character recognition (OCR) in Adobe Acrobat, converted into Excel spreadsheets, geocoded with Geoapify and analyzed in a Python notebook. 18 reports were removed from the dataset because their GPS locations fell outside the city boundaries or their assigned departments appeared unrelated to flooding—covering issues such as internal permits, right-of-way work, and solid waste.
Broward County
Broward County provided the Herald a geopackage file of the county’s Document the Floods dashboard; the dataset included 923 reports of flooding at 827 unique locations indicating that there were multiple reports submitted from the same locations. The data covers from October 2016 to November 2023.
City of Hollywood
Through a public records request, the Herald was provided a dataset of over 3,000 service requests for the City of Hollywood. When filtered to requests relating to flooding and flooding-related issues, the Herald found 317 relevant requests covering a timeframe from July 2021 to May 2024. According to the City Clerk’s office, these requests were reported through Hollywood Connect, the city’s portal for reporting non-emergency concerns.
City of Fort Lauderdale
Through a public records request, the Herald was provided a dataset of 1,174 hazard report requests from April to May of 2023, when the “1,000-year flood” occurred, placing much of Fort Lauderdale underwater for days. The requests were submitted through the city’s Lauderserv system. The Herald geocoded the records provided using the Google Maps Geocoding API.
Map Layers
FEMA Maps
The FEMA 100-year and 500-year maps were last downloaded from FEMA’s Flood Map Service Center in October 2025, along with preliminary maps for Miami-Dade County obtained from FEMA’s Preliminary Map Service Center. The layers were filtered to isolate only the 100-year and 500-year flood zones using geoprocessing libraries in a Python notebook. The shapefiles were then clipped to the project’s map boundaries and simplified with Mapshaper to prepare them for display on the Herald’s website.
Each flooding report was assigned to the correct FEMA flood zone through a series of spatial joins in a python notebook. Locations of reported flooding or drainage issues were joined to FEMA flood zone polygons based on whether they fell within each zone’s boundaries. This geoprocessing step ensured that every record could be analyzed according to its corresponding FEMA flood zone designation.
Water Layers
The shapefiles for the larger bodies of water such as rivers and oceans were mapped using the U.S. Census Bureau’s 2019 Tiger Water Shapefiles and FEMA’s Water Areas layer in the flood maps. Smaller rivers, canals, ponds and other water bodies were mapped from OpenStreetMap data.
Municipal Boundaries
The city boundaries for Miami-Dade were mapped from GIS data provided through Miami-Dade’s Open Data Hub. Broward County’s municipal boundaries were available through the Broward County GeoHub.
Community Labels
Individual city labels were geocoded using Google Maps.
Basemap
USGS satellite imagery
This story was originally published November 12, 2025 at 5:00 AM.